Quick mmibain Tutorial
bain is my primary tool for Bayesian informative hypothesis testing. The 'mmibain' R package contains web applications (along with some helper functions) built on top of the 'bain' software. This tutorial walks through a quick example where we'll use the mmibain() 'shiny' application to fit a linear model to the same data set used in the quick mmirestriktor tutorial. Once again, we will work with the data_f.csv file which you can download from the npboottprm GitHub.
Step 1) Open the Application
To open the mmibain() 'shiny' application, go to https://www.mightymetrika.com/mmibain and click on the mmibain button. This should open up the following application:

Step 2) Upload Data
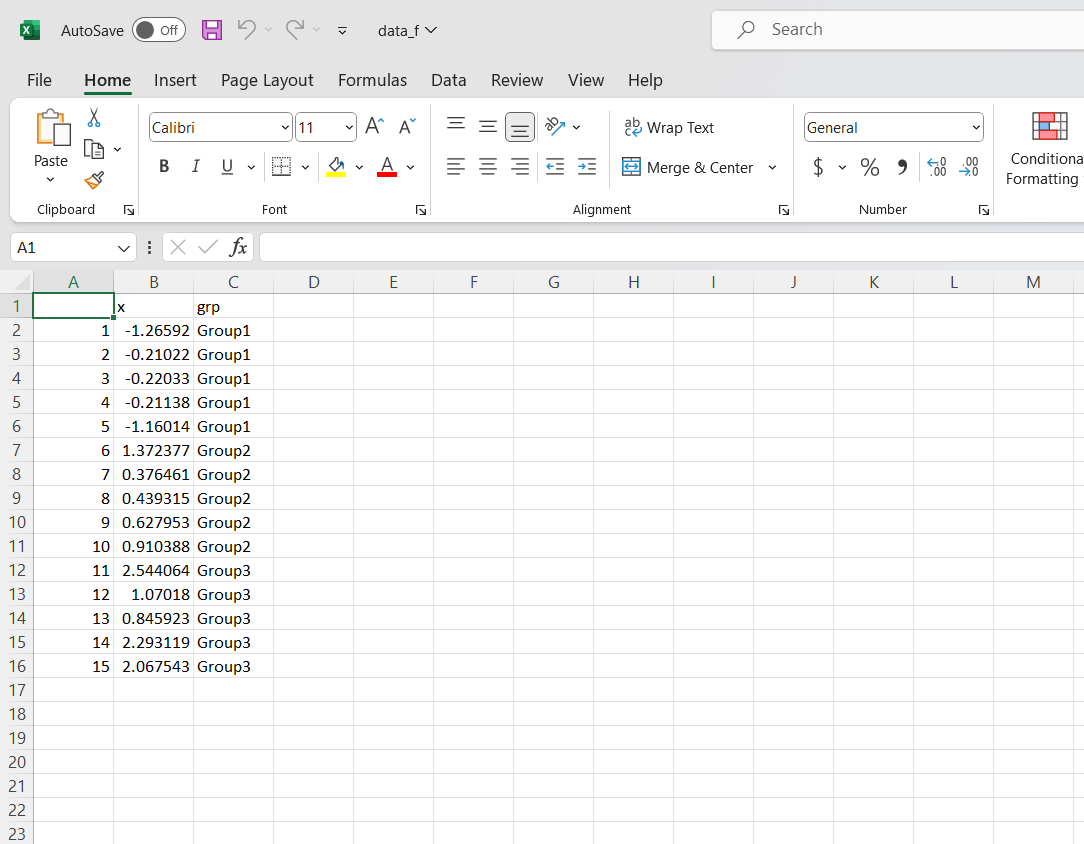
The data_f.csv file looks like this:
Step 3) Set Up Analysis
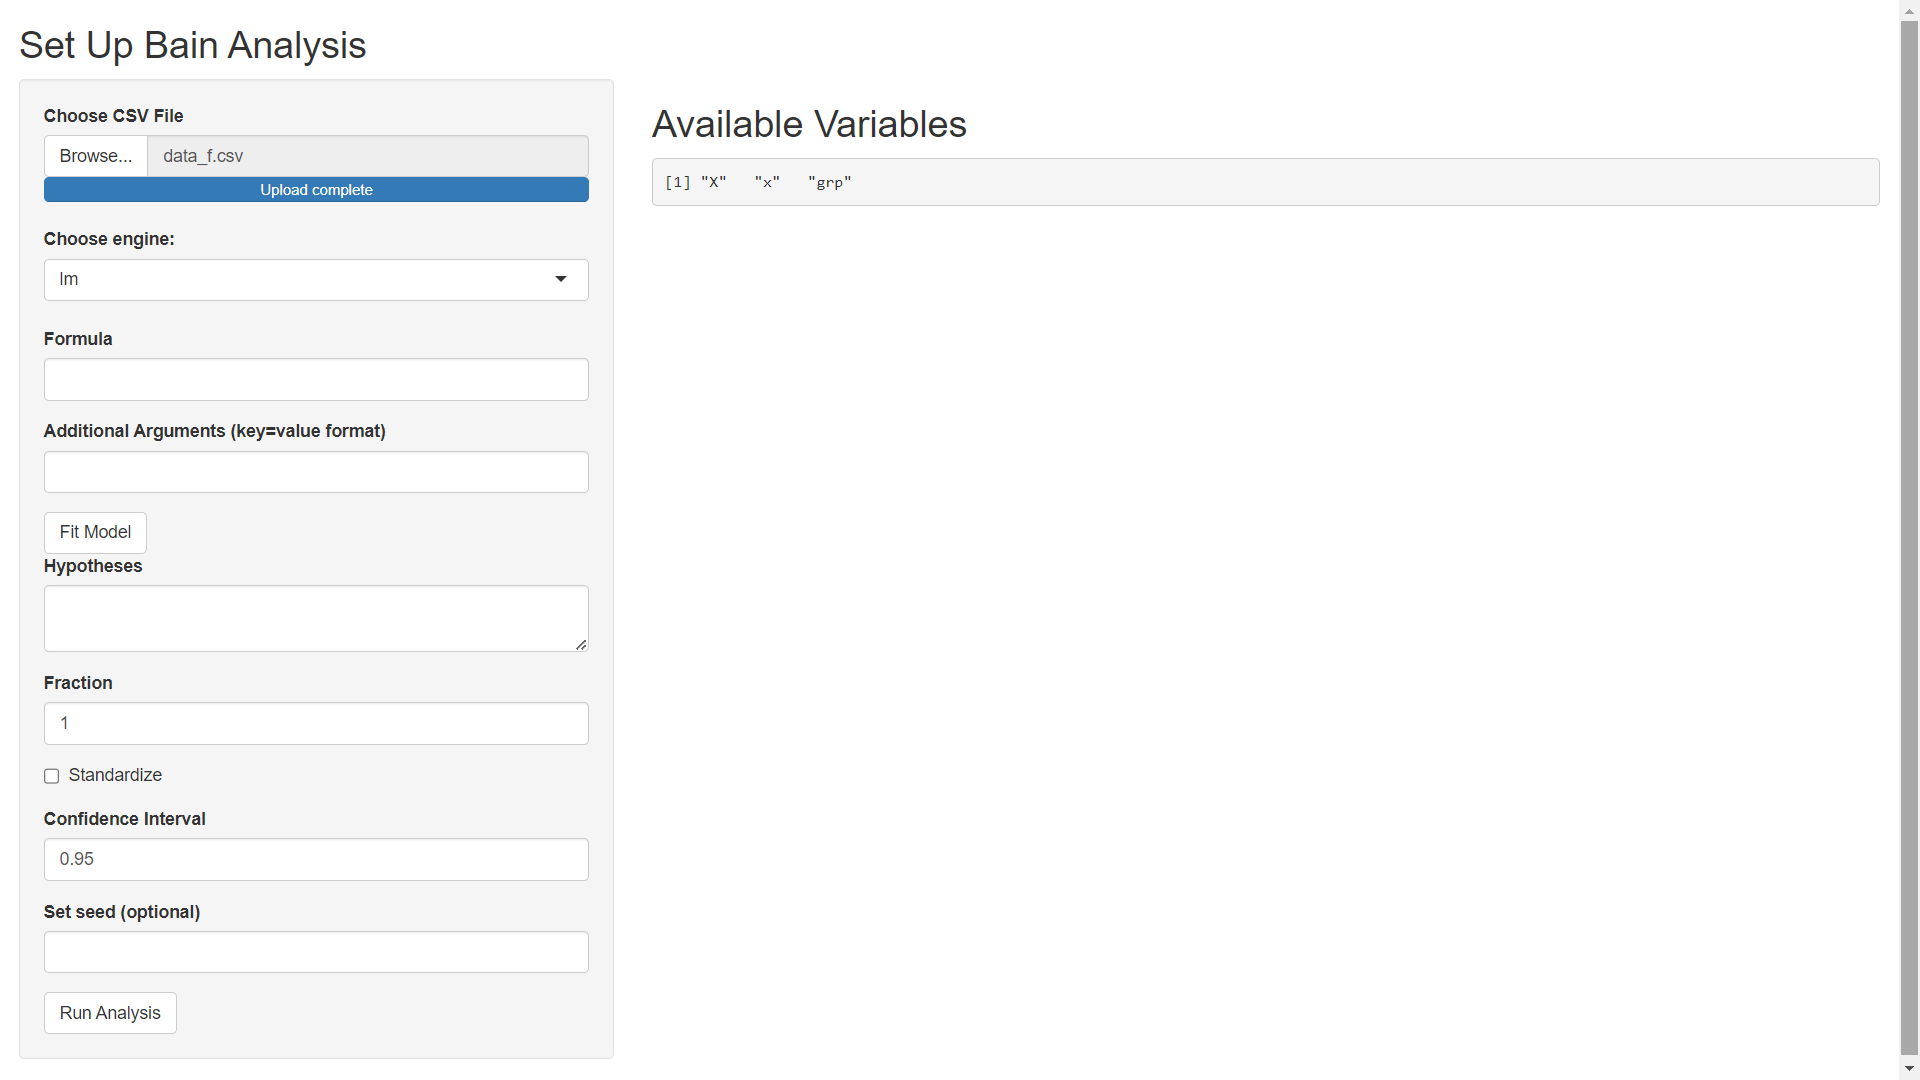
In the Upload CSV File section of the application, click Browse to find this data set on your computer and read the data into the app.
Once your upload is complete, you should see the following on your screen:
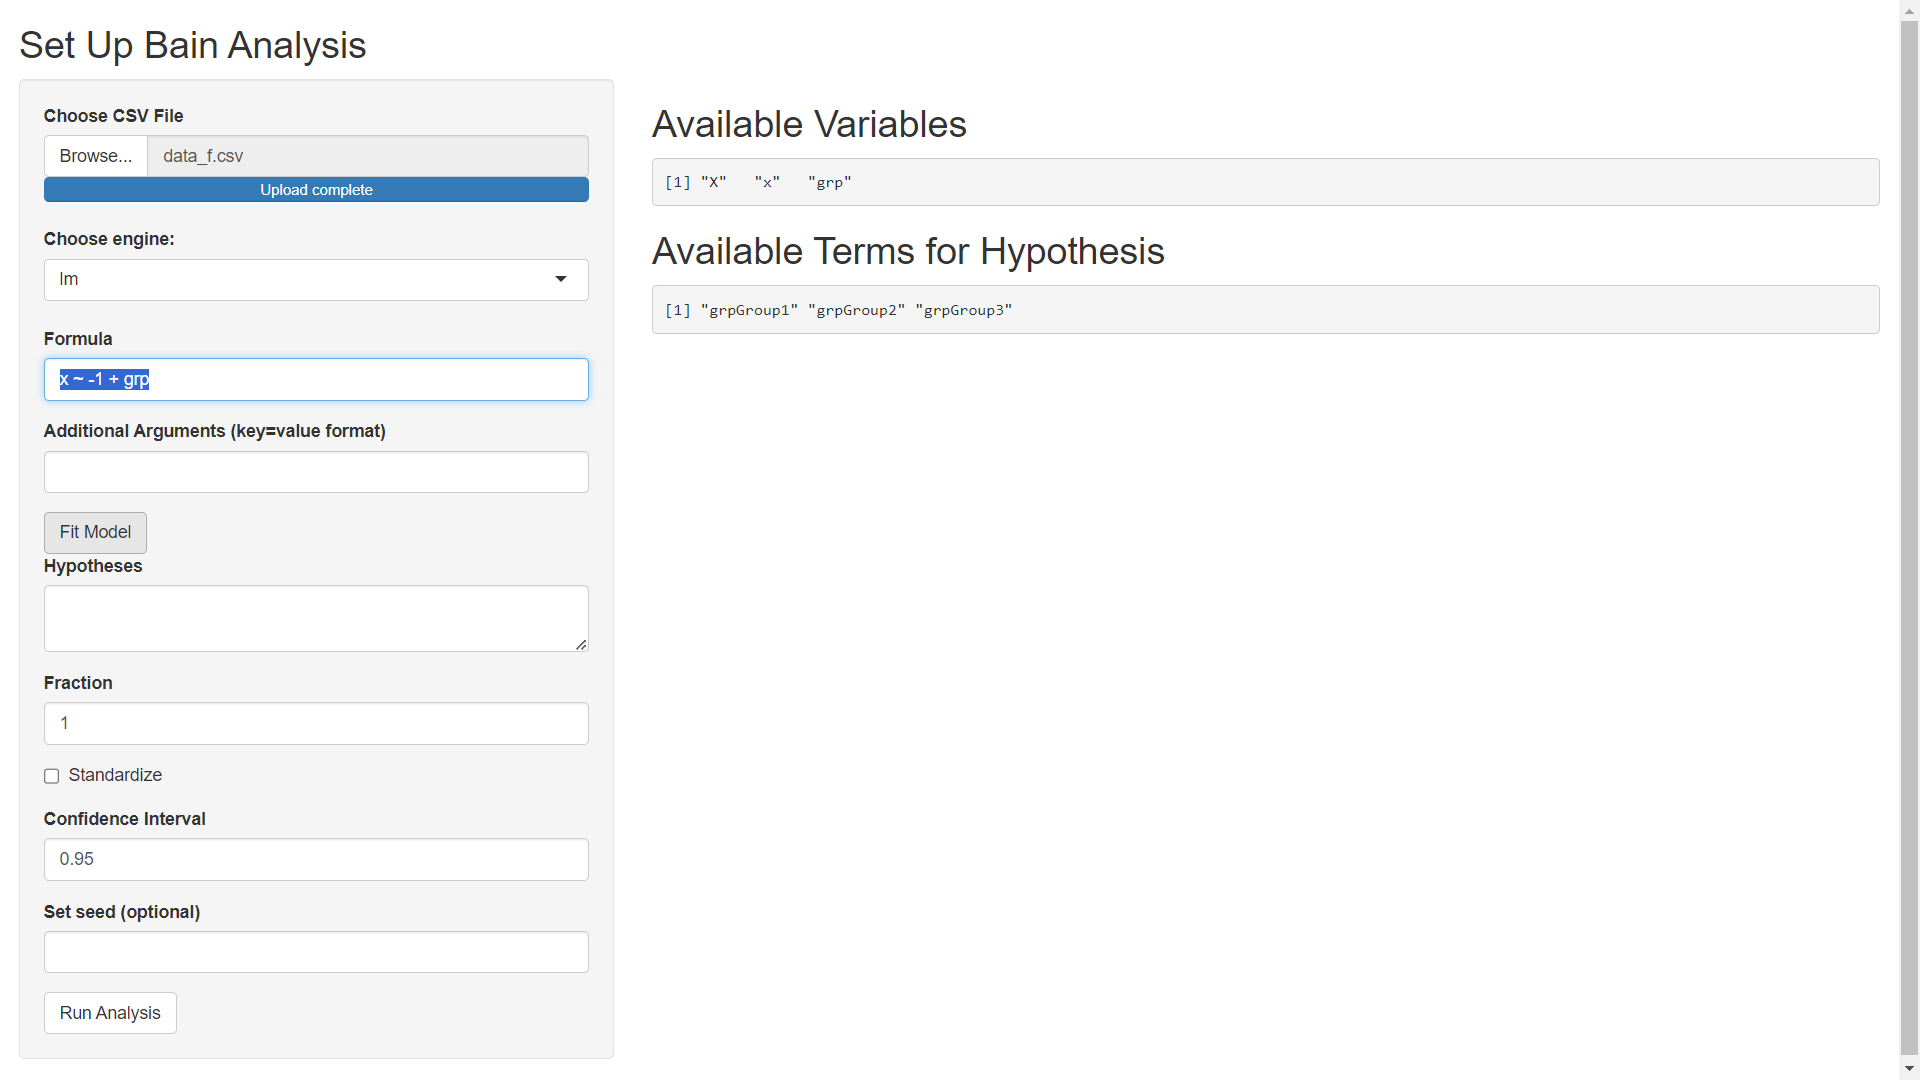
In what follows we will use the 'lm' engine to fit a model using the stats::lm function from R. Specify the Formula as x ~ -1 + grp (using -1 to remove the intercept so that none of our grps are used as a reference level). The Additional Arguments field can be used to pass extra arguments to the model fitting engine (stats::lm in this example but t_test or lavaan if a different engine is selected). In this example, we will not pass extra arguments to stats::lm. After specifying model details, click the Fit Model button to get the following screen.
Step 4) Specify Constraint
Using the terms available for constraint, specify the constraint. A great non-technical overview of using the Bayes Factor in the context of 'bain' is A tutorial on testing hypotheses using the Bayes factor; this tutorial will give you a foundation on how to specify constraints and how to use and interpret the Bayes factor. Another great resource is Introduction to bain vignette from the R package which includes tens of examples on how to construct constraints and how to use 'bain' in the context of the t-test, ANOVA, linear regression, and structural equation modeling.
For our example we will use the constraint: grpGroup1 < grpGroup2 < grpGroup3.
We will use the default Fraction of 1, we will not standardize our independent variables since the values for each group use the same units of measurements, we will leave the confidence level at 0.95, and we'll set the seed for random number generation to 100. After entering these settings click Run Analysis to obtain the Bayesian informative hypotheses evaluation results.
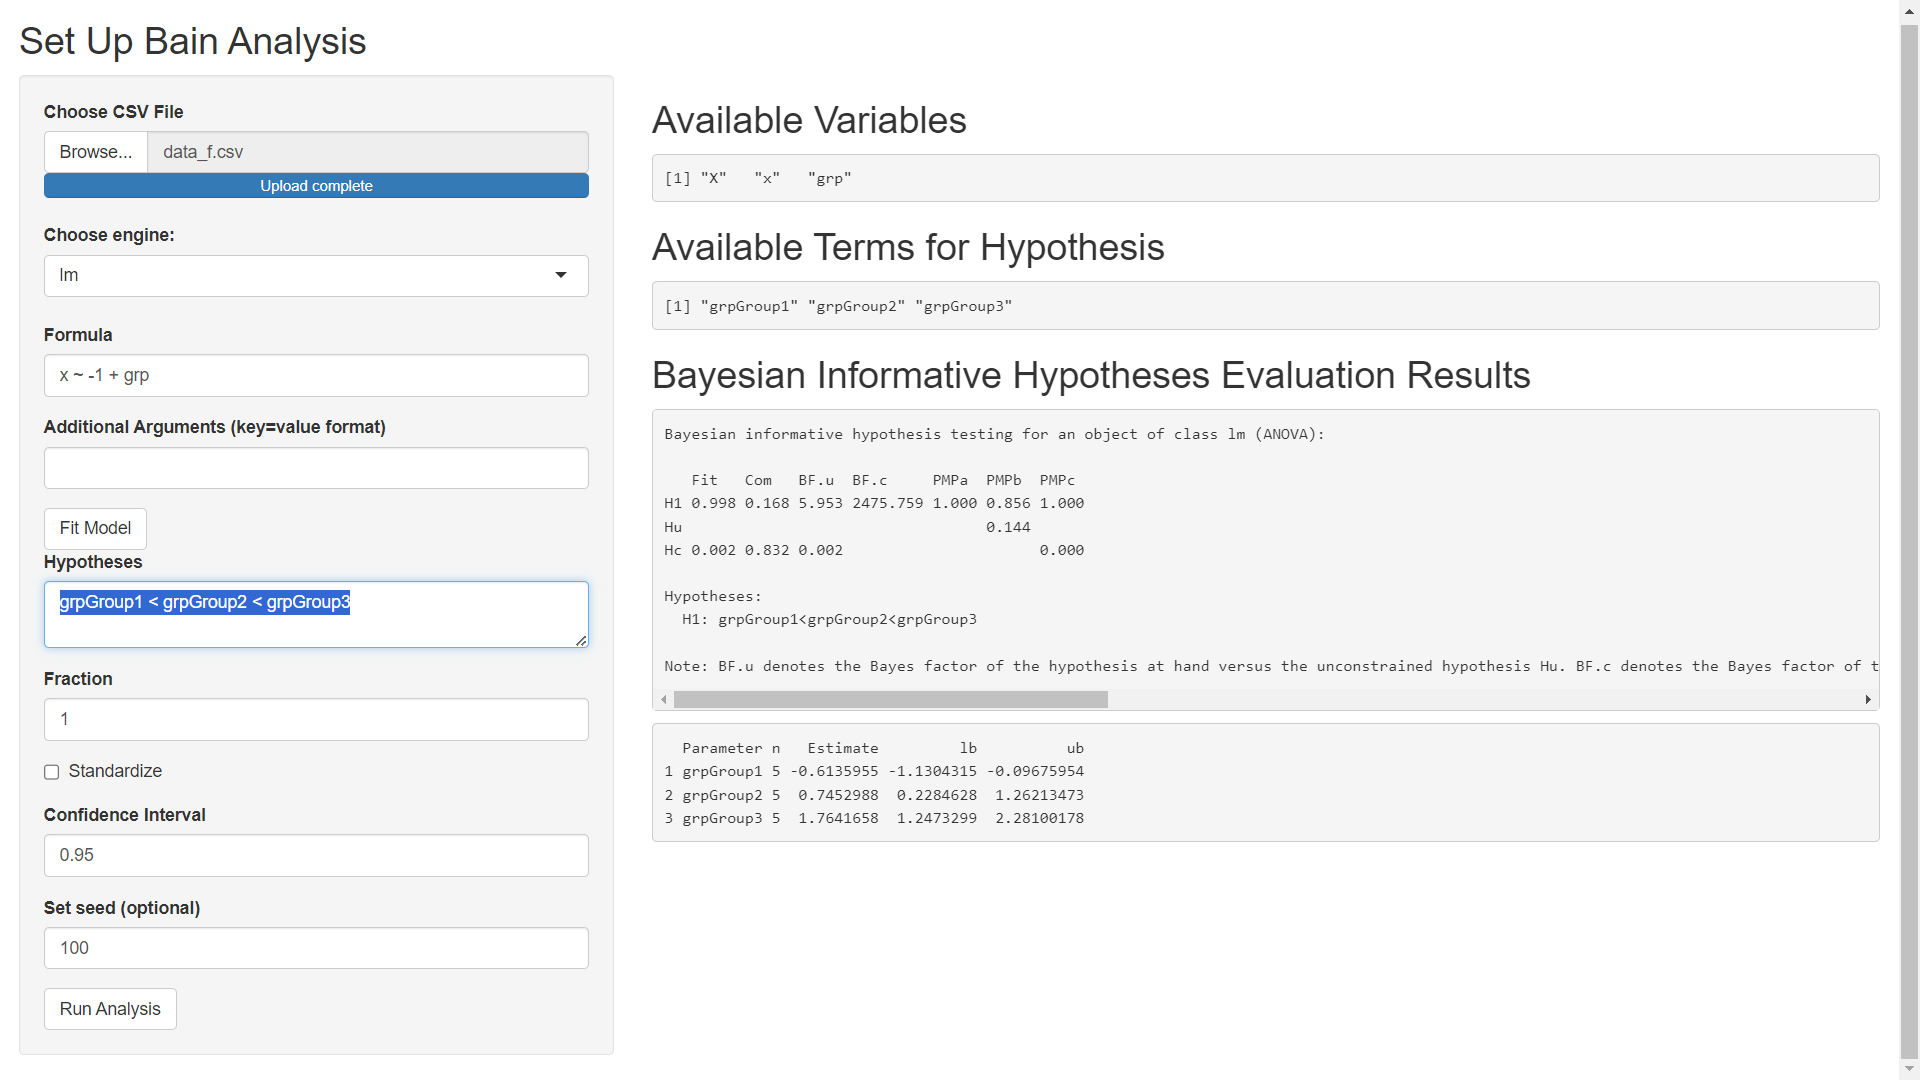
In this example, H1 is the hypothesis, "grpGroup1 < grpGroup2 < grpGroup3". The "Analysis of the Monin Data Using Informative Hypotheses paper, " section of the paper A Tutorial on Testing Hypotheses Using the Bayes Factor mentions that:
If a hypothesis is specified only using inequality constraints (that is, smaller than and larger than), the column labeled BF.c contains the Bayes factor of the hypothesis at hand versus its complement Hc, that is, not the inequality constrained hypothesis at hand.
In our example, the only hypothesis, H1, is specified only using inequality constraints. As such, BF.c gives us the Bayes factor of our H1 versus its complement. Here, we have evidence a Bayes factor of 2475.8 which is evidence of overwhelming support for H1.
To learn more about 'bain', you are encouraged to read the paper 'A tutorial on testing hypotheses using the Bayes factor'. Two seperate links to the abstract have been provided above; however, as of the writing of this post, you can also find the paper on ResearchGate: https://www.researchgate.net/publication/331029513_A_Tutorial_on_Testing_Hypotheses_Using_the_Bayes_Factor
The paper delves into important issues that were only glossed over in this blog post including:
- Defining constraints
- Setting the priors (i.e., Fraction)
- Interpreting Bayes factors
- Interpreting Bayesian error probabilities
- Interpreting results when using both equality and inequality constraints
- Using multiple hypothesis in one analysis
- Bayesian updating
- Analysis of replication studies
The paper is a rich tutorial that opens the doors to what is, for most of us, a whole new paradigm for statistical inference.